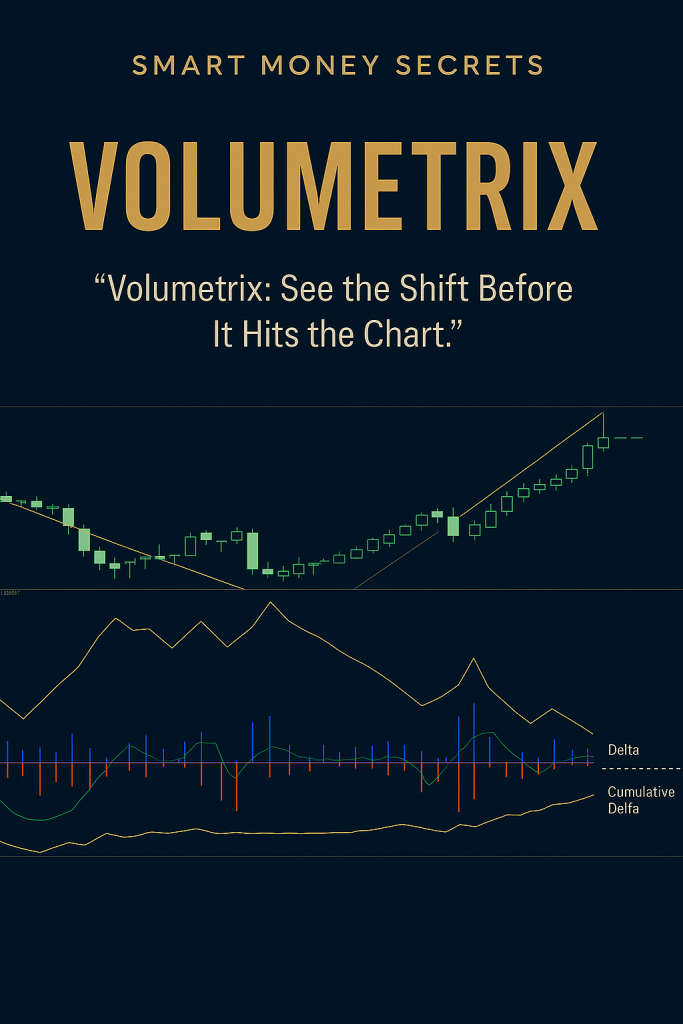
Volumetrix: See the Shift Before It Hits the Chart.
“All warfare is based on deception.”
― Sun Tzu, The Art of War
This is Part 4 of a 4-part blog series exposing the myths and traps of retail trading.
🔍 Why Volume Matters More Than You Think
Price lies. It can be manipulated, delayed, or misleading. But volume exposes the truth — the raw aggression between buyers and sellers.
Most retail traders use lagging indicators: Stochastics, RSI, Moving Averages. But by the time those tools flash, the move has already begun.
That’s why Volumetrix exists. It’s not just another volume indicator — it’s an early warning system for market shifts, pivot formations, and hidden smart money activity.
⚔️ What Is Volumetrix?
Volumetrix is a precision tool designed to read the intention behind price, not just the result. It captures shifts in buying and selling pressure with real-time accuracy, giving you insights before most traders even react.
At its core is the delta line — a real-time measure of the imbalance between buying and selling. When this line crosses zero, it typically signals a change in control before or just after a new candle forms.
That signal often comes before oscillators react.
That’s why Volumetrix leads. It doesn’t follow.
- Note on Objectivity of Data:
- It’s important to understand that the Volumetrix indicator does not rely on adjustable settings to produce signals based on your assumptions of where the market should pivot. Instead, it tracks real-time volume activity, reflecting what is actually happening in the market—not what you want to see.
- This differs fundamentally from conventional indicators like Moving Averages (50, 100, 200), Stochastics (12, 26, 9), or RSI (14), where changing the settings alters the entire perspective. These tools are interpretive by nature, shaped by the parameters you choose—offering a view of the market filtered through your own lens, not the raw truth.
- Volumetrix doesn’t guess. It shows the actual volume behavior of the market as it unfolds.
🧠 What It Can Do for You
Whether you’re a scalper or a swing trader, Volumetrix gives you:
✅ Early signals of trend reversals and pivot shifts
✅ Visibility into buyer vs seller strength
✅ A weapon against FOMO and hesitation
✅ Real-time feedback to validate or reject your setup
It’s like having a direct feed to the smart money’s decision-making process. No second-guessing. Just clarity.
🚀 Why It’s Superior to Traditional Volume Indicators
While standard volume tools show bar heights and colours, Volumetrix breaks down the fight into four powerful layers:
🟩 1. Buy Volume
Reveals how much bullish interest is hitting the market. A surge in buy volume during a pullback? That’s accumulation.
🟥 2. Sell Volume
Exposes the weight of bearish pressure. If it increases during a push upward, that may be a trap or fakeout.
⚖️ 3. Delta
This is the core of the system. The delta line tracks the net difference between buy and sell pressure. When it crosses zero, it’s often the first clue that a pivot is forming.
📈 4. Cumulative Delta
The longer-term story of buying vs selling. It shows whether bulls or bears are gradually gaining ground — even when price appears to chop.
But here’s the key: Cumulative Delta often crosses zero before the Delta line, giving you an even earlier heads-up that a pivot is forming. It’s also excellent for spotting divergence — when price continues in one direction but cumulative delta shows fading strength. This lets you check your other tools (oscillators, structure, fibs) to confirm a potential market shift before it becomes obvious.
🔂 How to Apply Volumetrix
🧭 Use Across Multiple Timeframes
Delta flips on higher timeframes (like H1 or H2) can be major pivot warnings. Then zoom into M15 or M5 to find your precise entry. This multi-timeframe confluence sharpens accuracy and reduces noise.
⏱️ Don’t Ignore Non-Traditional Timeframes
Standard charts (H4, Daily) often miss subtle shifts. Use Volumetrix on 2H, 3H, or 6H charts to spot changes that bridge the gap between swing and intraday moves. These windows often catch the smart money rotation.
💡 Stay Ahead of Emotions
Most traders either:
- Jump in too early
- Exit too soon
- Or freeze from hesitation
Volumetrix keeps you calm by showing the truth beneath price. If delta supports your bias, hold strong. If it shifts against you — step away or hedge. It’s data over drama.
🧩 For Beginners and Advanced Traders
🔰 Beginners gain confidence seeing why a move is forming.
⚔️ Pros get a tool that sharpens execution and exposes fakeouts.
Whether you’re learning or mastering, Volumetrix gives you an edge.
🧠 Final Thought
There’s a reason smart money wins — they act on information before price reflects it.
Now you can too.
“Volumetrix: See the Shift Before It Hits the Chart.”
What’s Next?
If you’ve made it this far, you’re ready for something deeper.
Check out the Features and Use page to understand how to use Volumetrix.
🧠 Or head back to the Smart Money Secrets Homepage
Where everything we teach begins with one truth:
You are the edge.
🛒 Ready to Trade Smarter?
👉 Get VoluMetrix – Order Flow Indicator for MT4
See the shift before it hits the chart.
