Features & Use Guide
“Precision Without Hesitation. Clarity Without Delay.”
Welcome to the in-depth guide on how Volumetrix works — and why it works. This page breaks down the tool’s four key features, showing you not only what they are but how to use them like a pro.
⚔️ The Four Core Features
Volumetrix doesn’t just show raw volume data. It reveals intention — who’s pushing the market, where the strength lies, and when that strength is shifting.
Here’s a quick overview of what’s under the hood:
- 🟩 Buy Volume: Shows how much bullish force is entering the market.
- 🟥 Sell Volume: Exposes the weight of bearish pressure — even if price is rising.
- ⚖️ Delta: Measures real-time imbalance between buyers and sellers. Often the first to flip before pivots form.
- 📈 Cumulative Delta: Tracks long-term shifts in control — great for divergence, strength analysis, and holding power.
- Note on Objectivity of Data:
- It’s important to understand that the Volumetrix indicator does not rely on adjustable settings to produce signals based on your assumptions of where the market should pivot. Instead, it tracks real-time volume activity, reflecting what is actually happening in the market—not what you want to see.
- This differs fundamentally from conventional indicators like Moving Averages (50, 100, 200), Stochastics (12, 26, 9), or RSI (14), where changing the settings alters the entire perspective. These tools are interpretive by nature, shaped by the parameters you choose—offering a view of the market filtered through your own lens, not the raw truth.
- Volumetrix doesn’t guess. It shows the actual volume behavior of the market as it unfolds.
Now let’s break each of them down.
🟩 Buy Volume
What It Is:
Buy Volume measures the amount of aggressive buying hitting the market during each candle — not passive orders, but market buys showing conviction.
What It’s Good For:
- Spotting accumulation during pullbacks
- Validating bullish breakouts
- Confirming support holds
- Identifying Divergence.
- Quickly spot the dominant volume for the current candle.
What It Does:
When Buy Volume surges while price stalls or dips slightly, it’s a clue that smart money is loading up — often before the breakout.
How to Use It:
- During a pullback, if Buy Volume rises while price stays stable, expect a bullish continuation.
- Combine with structure: rising Buy Volume near a Fibonacci level or previous support = higher probability entry.
- Multiple timeframe analysis for confluence to maximise successful trade entry and exit.
🟥 Sell Volume
What It Is:
Sell Volume tracks the total aggressive selling in the market — market sell orders that show active bearish pressure.
What It’s Good For:
- Detecting distribution during rallies
- Spotting fakeouts or bull traps
- Confirming resistance holds
What It Does:
If Sell Volume is increasing while price is moving up, it often means the rally is not genuine — and may reverse soon.
How to Use It:
- In an uptrend, rising Sell Volume can be a warning sign of a trap move.
- Look for it at resistance zones or after a long wick candle — it often confirms that bulls are being baited and absorbed.
⚖️ Delta
What It Is:
Delta is the net difference between Buy Volume and Sell Volume on each candle. A zero-cross shows a shift in control.
The Delta feature is the most important feature of the entire set.
What It’s Good For:
- Catching early pivot signals
- Detecting change in dominance
- Confirming entry/exit points
What It Does:
Delta flips when control changes hands — from buyers to sellers or vice versa. It often flips before the candle closes or just after the pivot candle, giving you an edge on price.
How to Use It:
- Watch for Delta crossing from negative to positive (or vice versa).
- On M15 or M5, it can signal a tradeable shift.
- On H1 or H2, it warns of major structural pivots forming.
- On higher timeframes it provides an indication of what the price will do during that period, whether it is 4 hours, 8 hours, half a day, day or week.
- Multiple timeframe analysis for confluence to maximise successful trade entry and exit.
- Helps eliminate FOMO buy waiting for the Delta line to cross above or below the zero line.
- On higher timeframes gives you a clear indication if you are on the wrong side of the market.
- The Delta line ranges in a predictable range, providing a heads up to incoming divergence and a change is direction, to expect a pivot.
📈 Cumulative Delta
What It Is:
Cumulative Delta tracks the total net delta over time, building a rolling picture of market control.
The Cumulative Delta is
What It’s Good For:
- Identifying trend strength
- Spotting divergence between price and momentum
- Strengthening confidence in swing trades
What It Does:
While Delta looks at the current candle, Cumulative Delta looks at the bigger picture. It reveals if bulls or bears are gaining or losing ground even if price is flat or deceptive.
How to Use It:
- Look for divergence: price may be climbing, but if Cumulative Delta is flat or falling, the move is losing strength.
- Use it to hold trades longer when it aligns with your bias, or exit early when it turns against you.
- Often flips before Delta, acting as an ultra-early warning system.
✅ Final Note
Each feature of Volumetrix is strong on its own — but when used together, they form a weapon. A live, real-time battlefield report of who’s winning — and when to strike.
As Volumetrix focuses on the current bar it is important to consider your trade plan across multiple timeframes that suit your trading style. It is recommend to bridge the game between the 4 hr and 1 hr chart with a 2 hour chart.
Also to bridge the gap between a Day chart and 4 hr chart with a 16 hour, 12 hr and 8 hr chart. These charts opening of a new bar also coincide with different market open and overlap times.
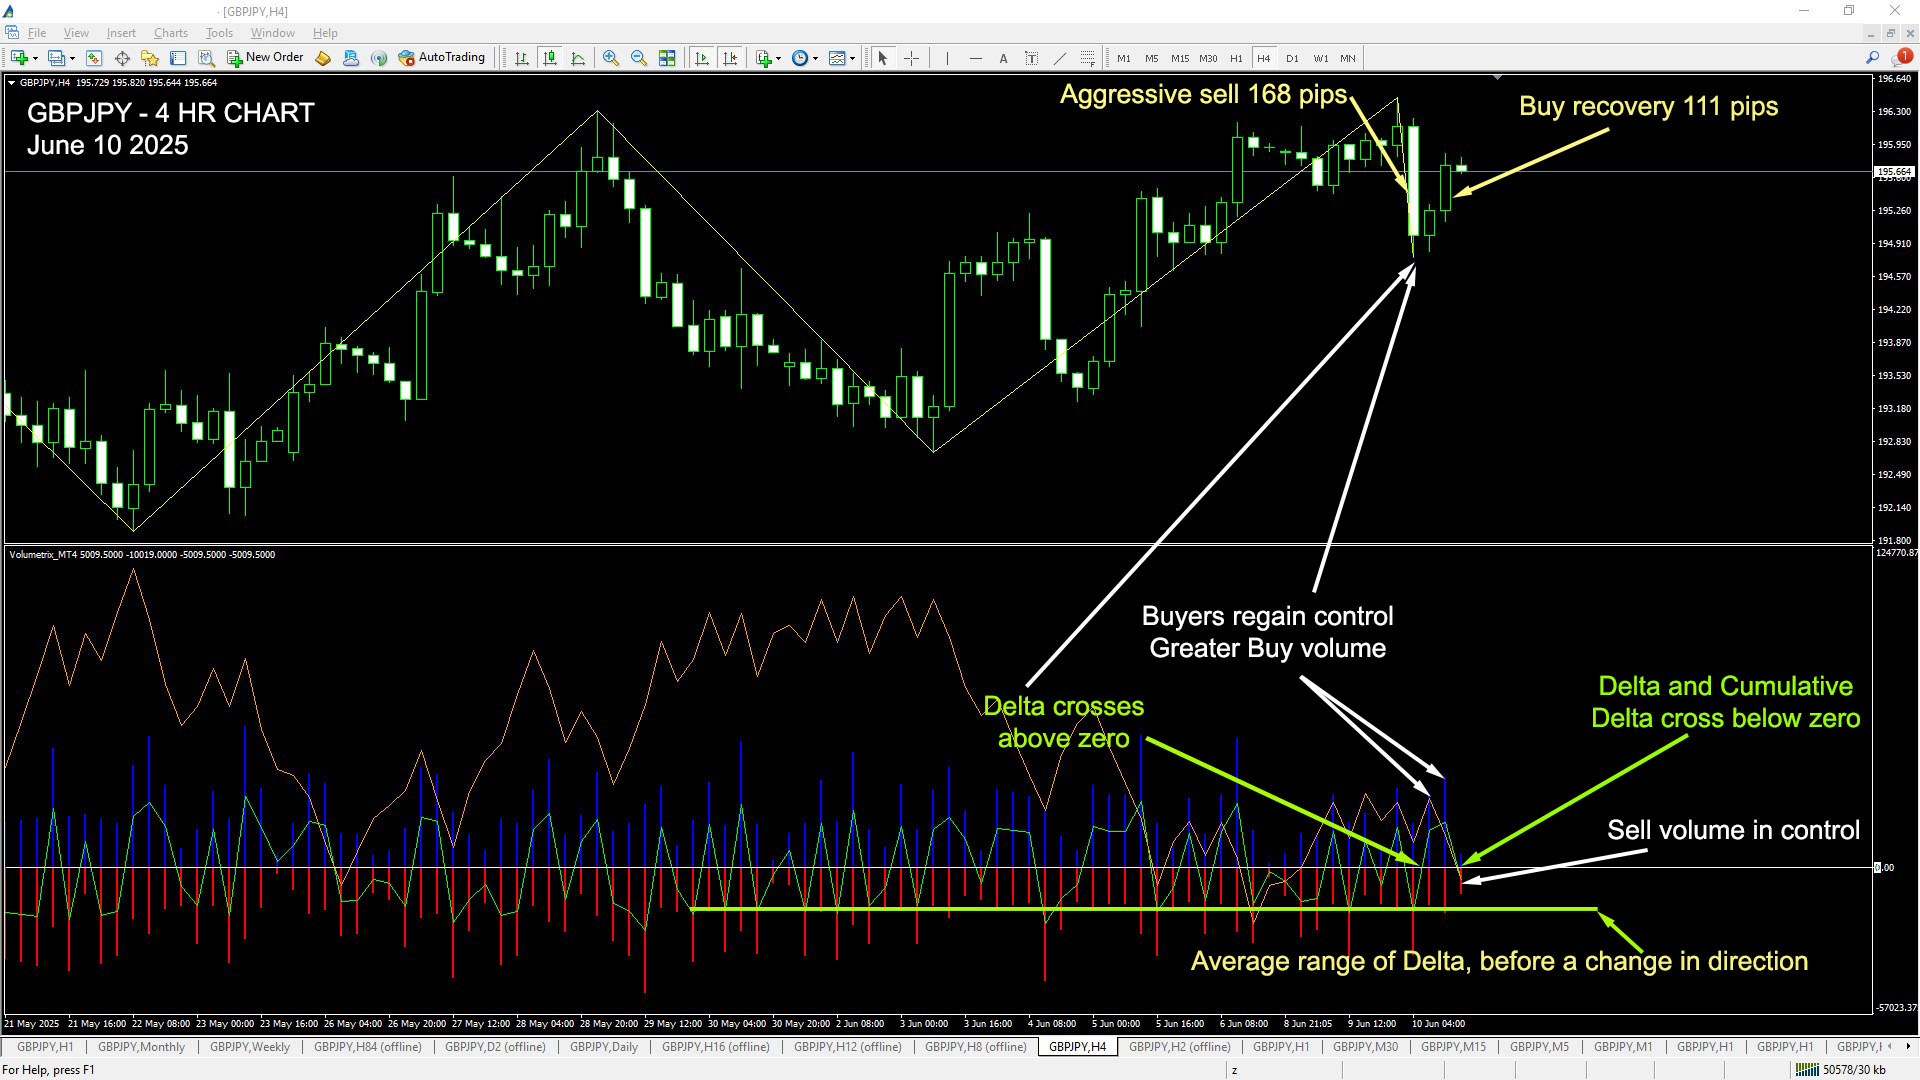
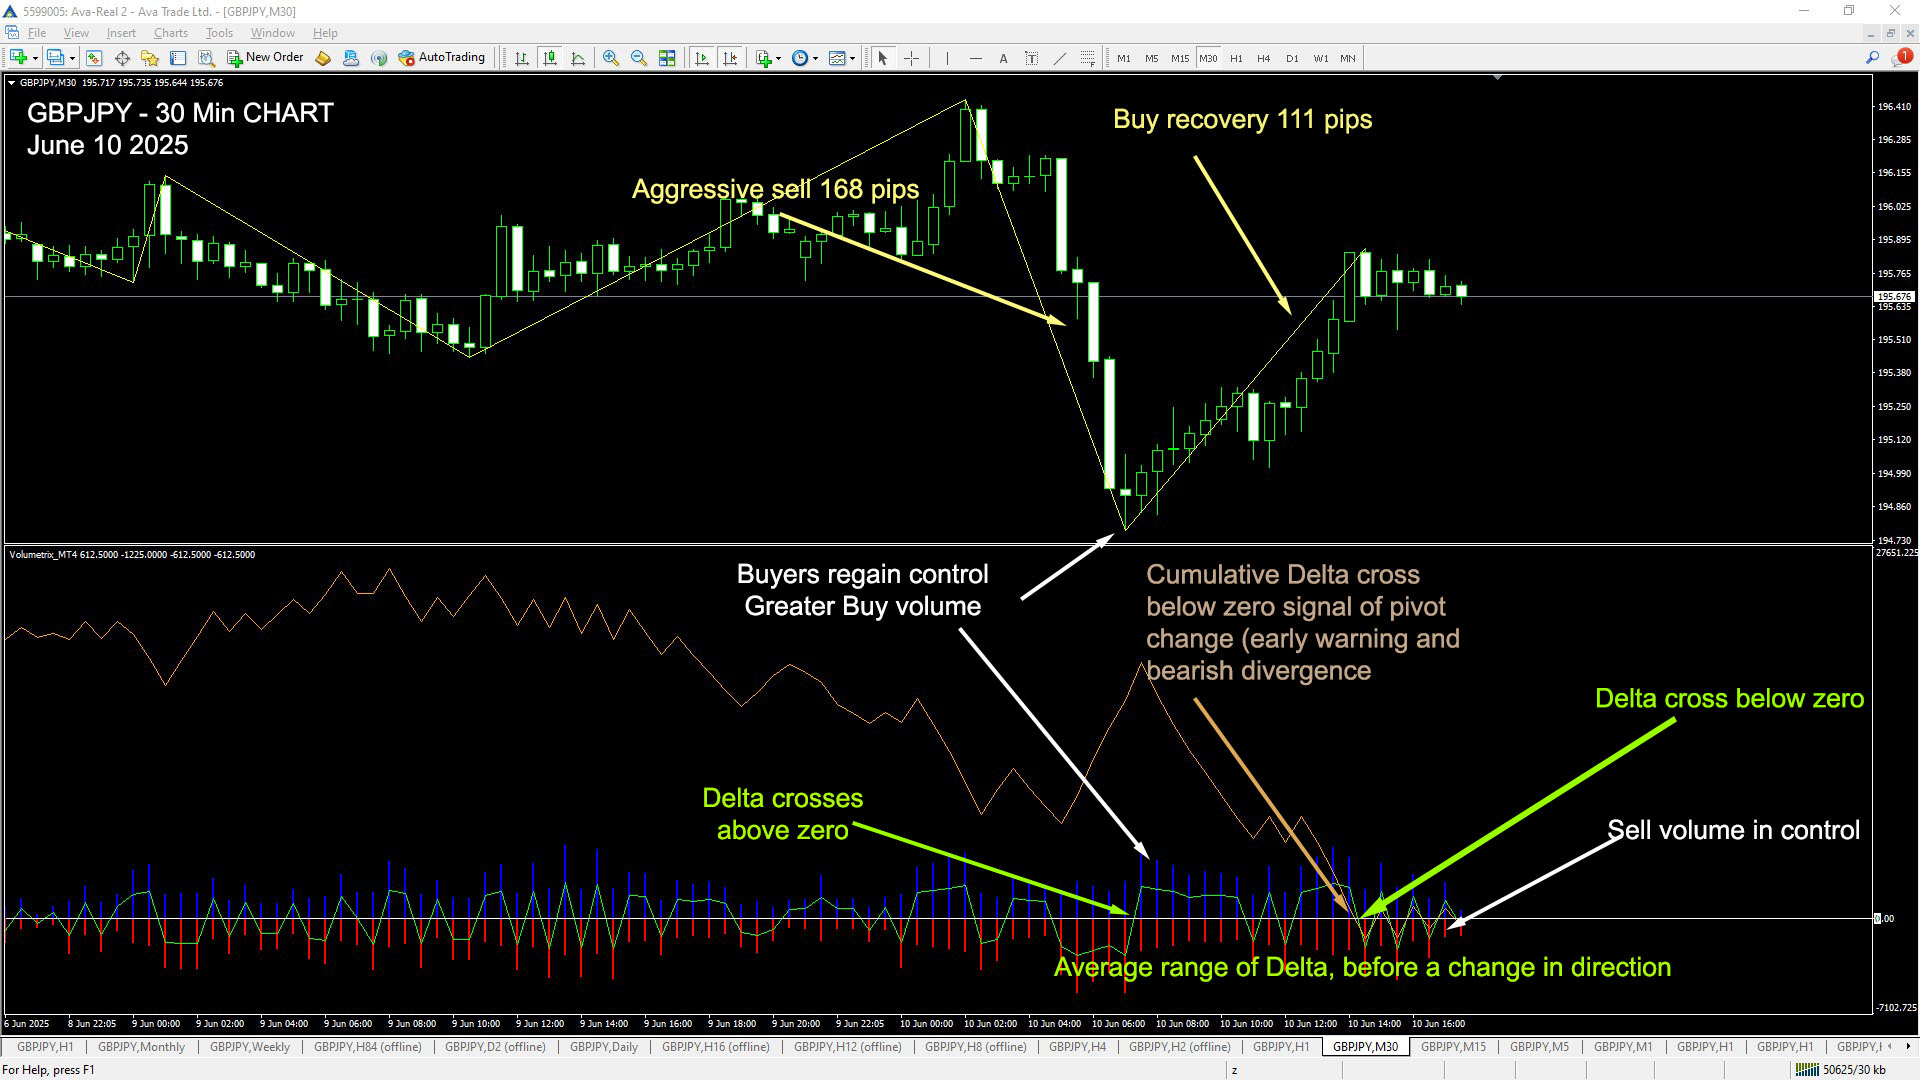
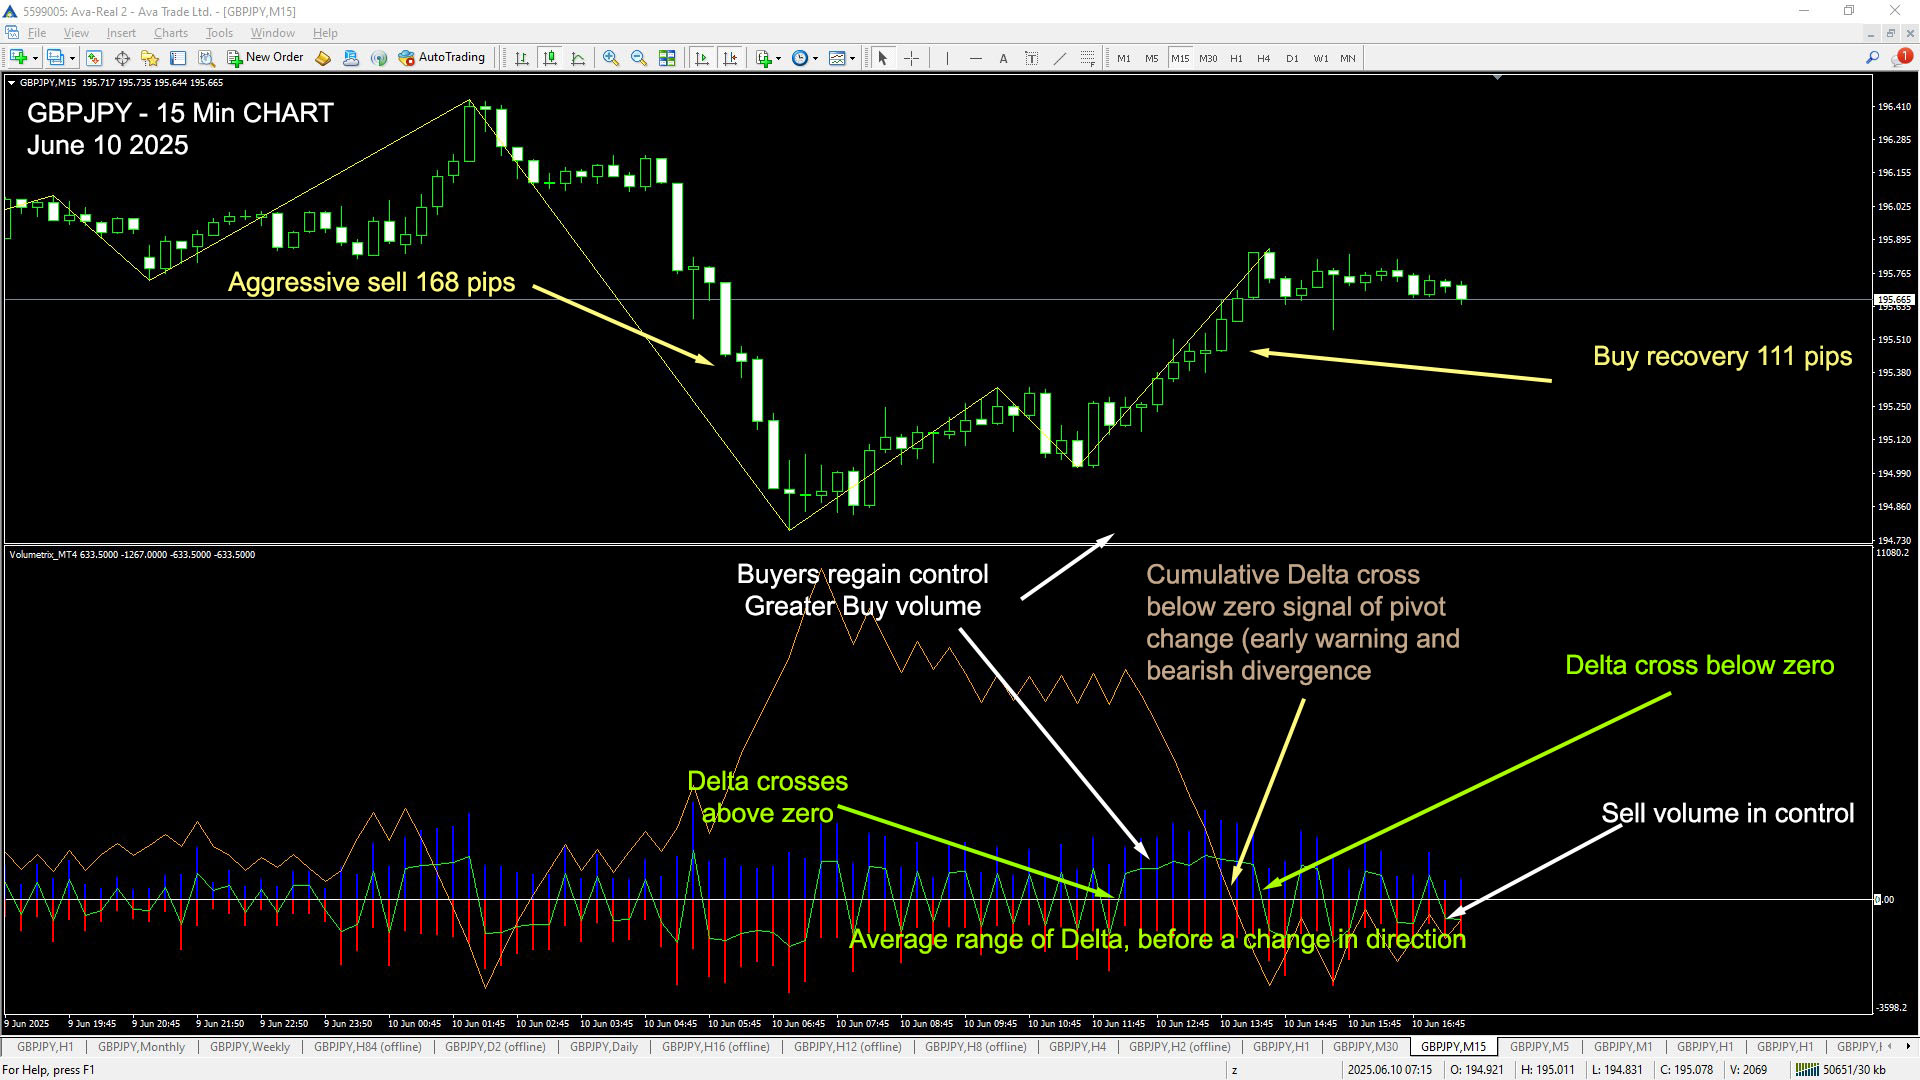
The following 5 screenshots are from GBPJPY price action on June 10 2025, with the following charts
4hr, 2hr, 1hr, 30 min, 15 min. This is designed to show confluence across these timeframes.
Images will open a new tab.
4 Hr Chart
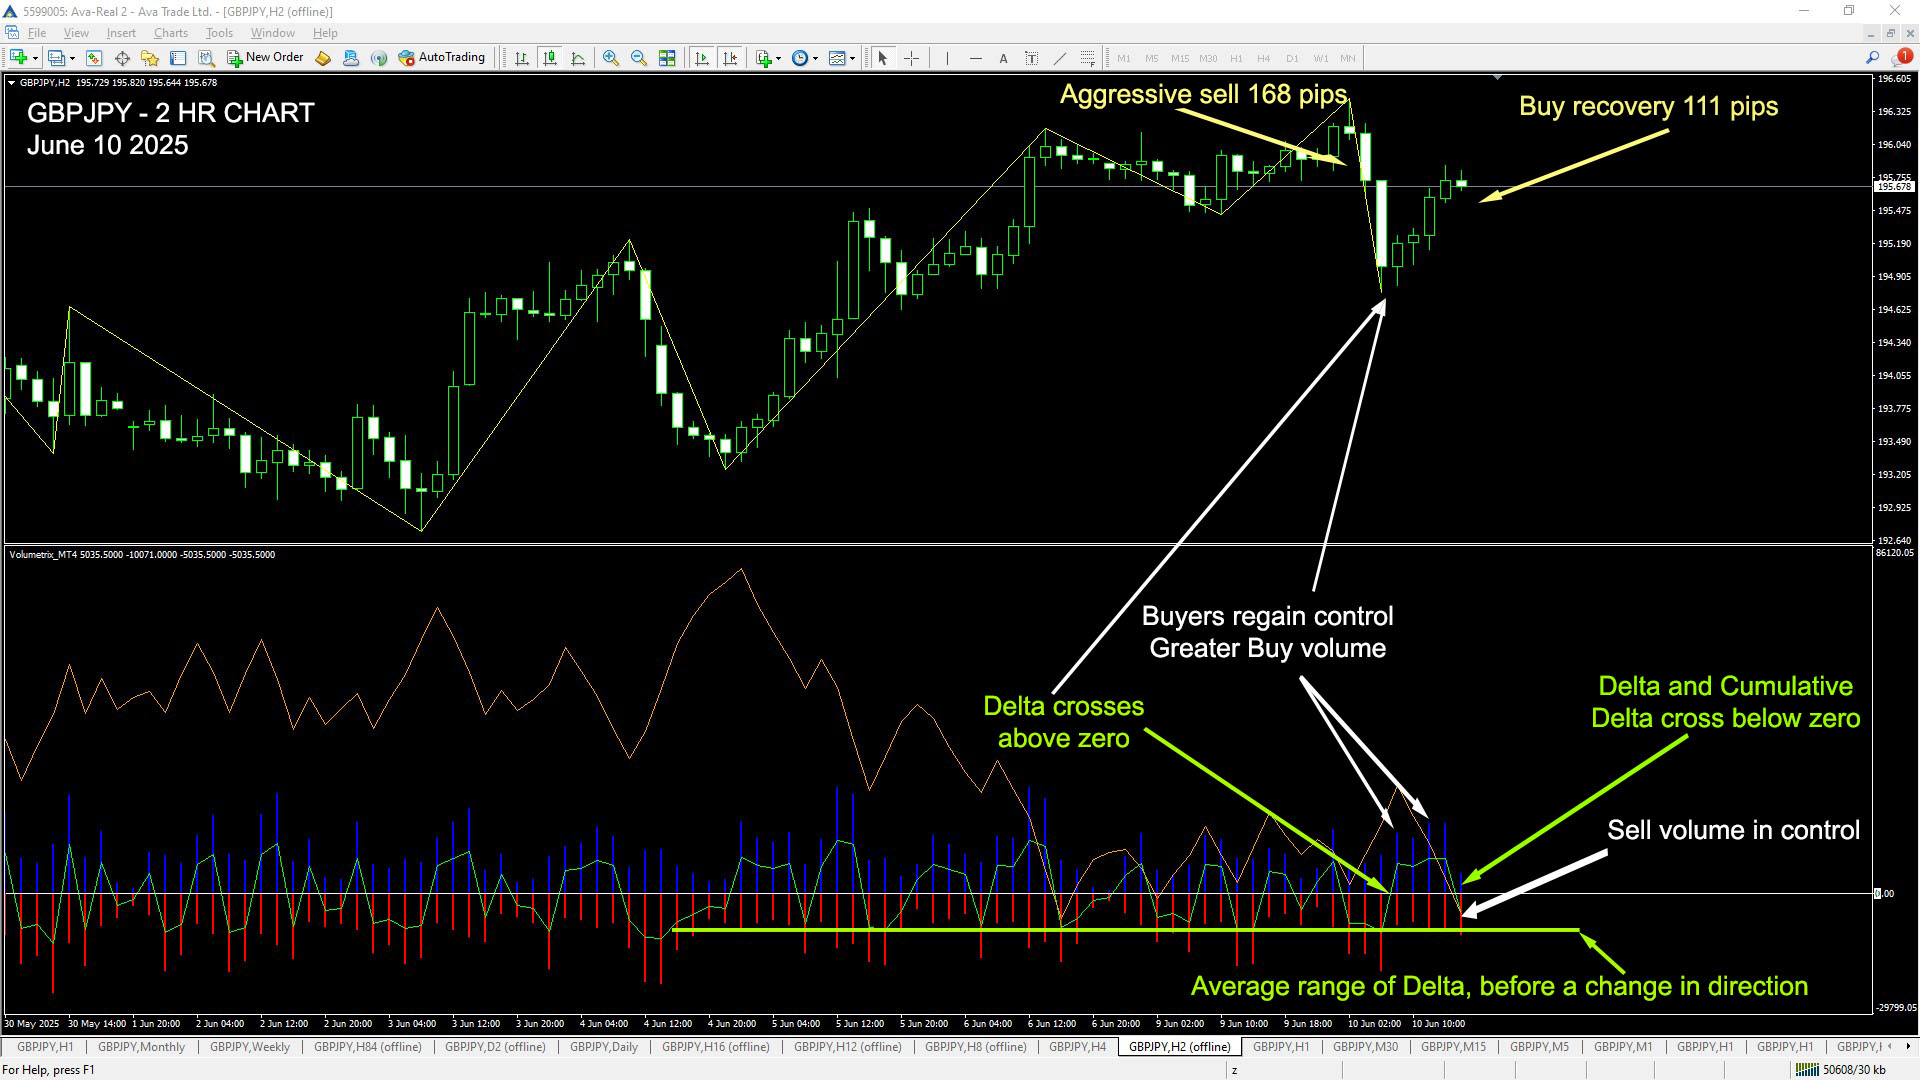
2 Hr Chart
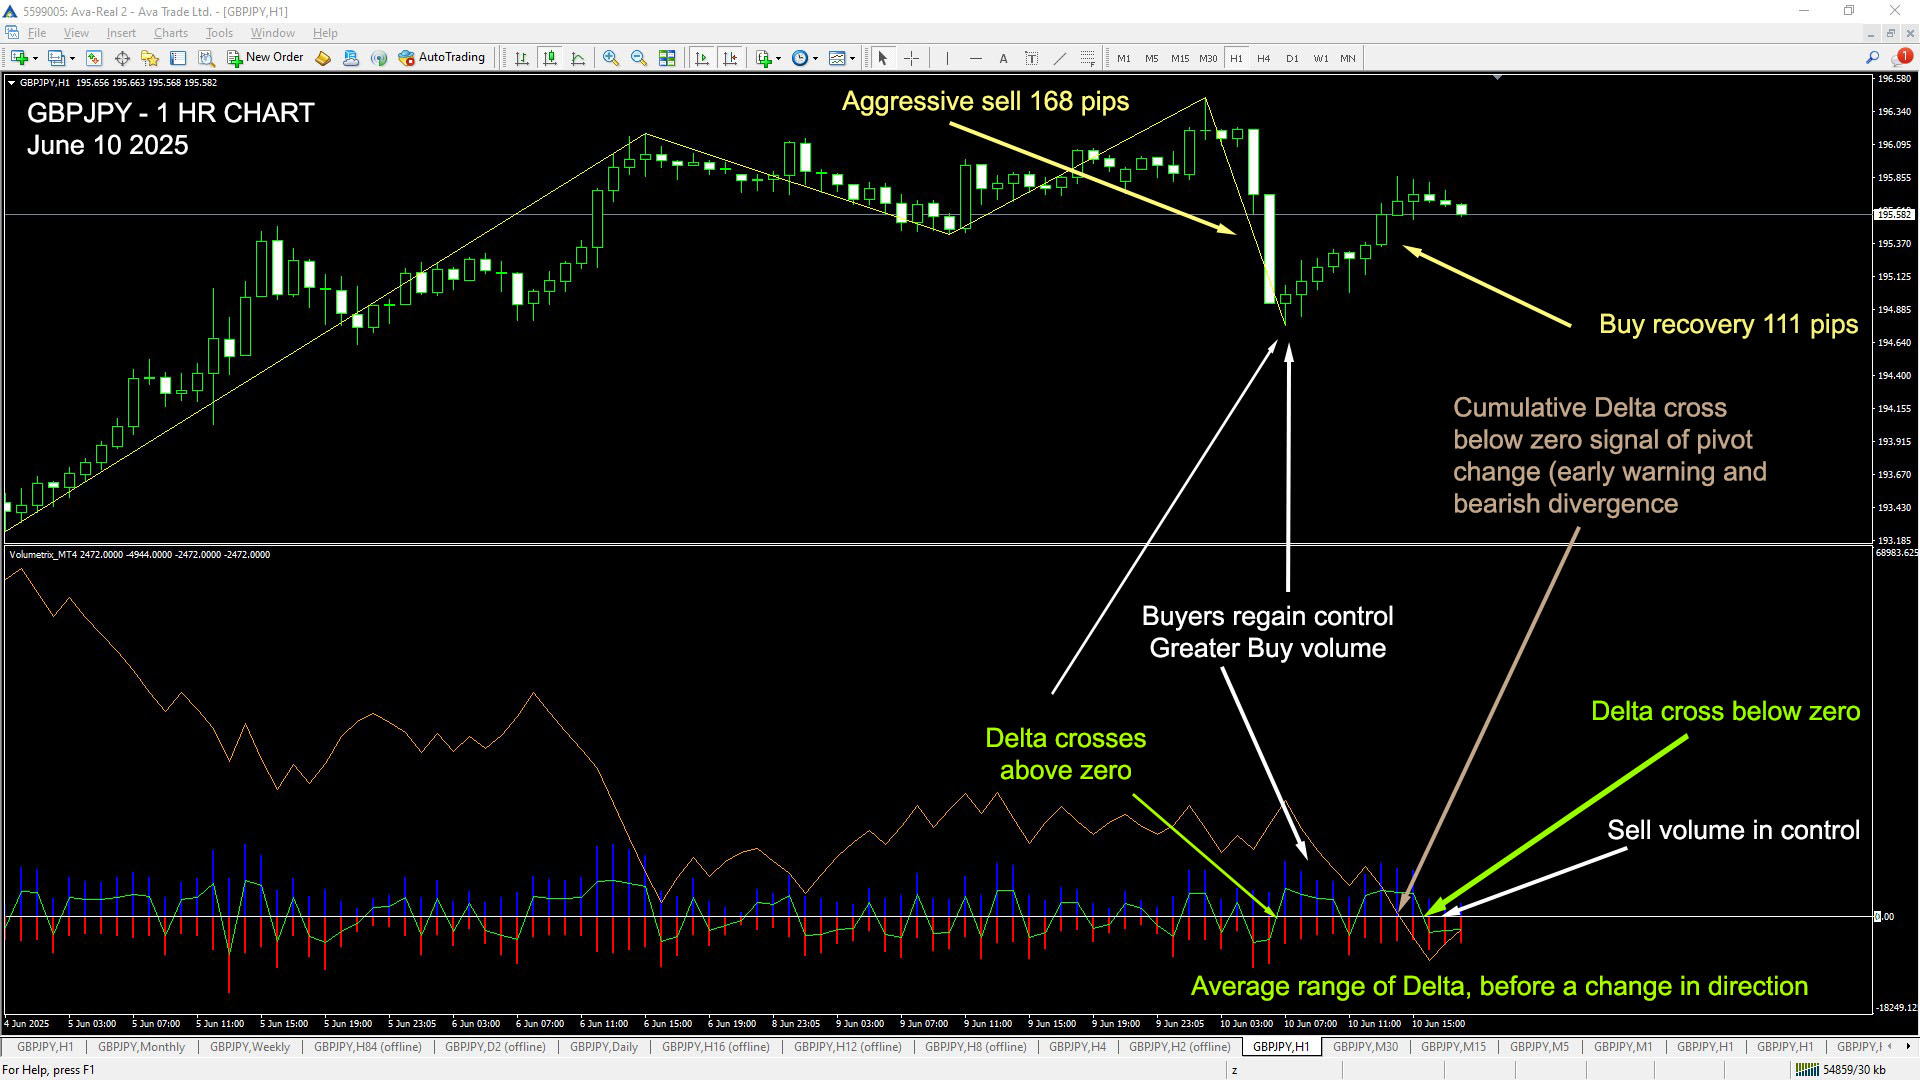
1 Hr Chart
30 Min Chart
15 Min Chart
🧠 Head back to the Smart Money Secrets Homepage
Where everything we teach begins with one truth:
You are the edge.
🛒 Ready to Trade Smarter?
👉 Get VoluMetrix – Order Flow Indicator for MT4
See the shift before it hits the chart.
