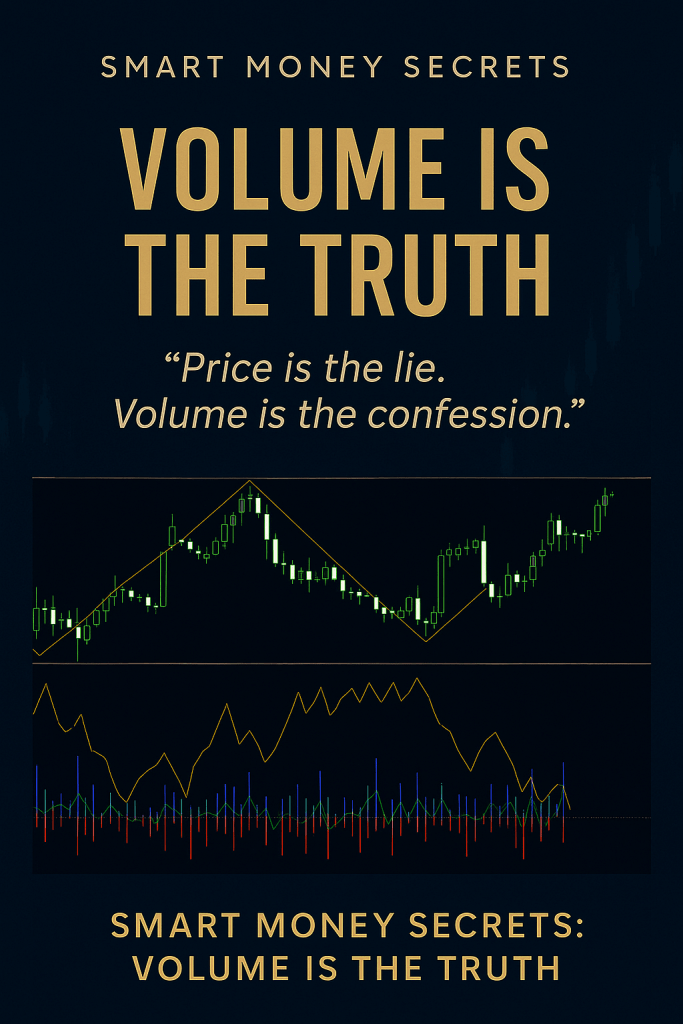
“Price is the lie. Volume is the confession.”
“Let your plans be dark and impenetrable as night, and when you move, fall like a thunderbolt.”
― Sun Tzu, The Art of War
This is Part 3 of a 4-part blog series exposing the myths and traps of retail trading.
Why Volume?
Volume is the blood flow of the market.
It shows the intensity, conviction, and presence of smart money — the institutions, banks, and funds that move the market.
Most retail traders chase candles.
Smart traders follow footprints — and those footprints are made of volume.
Volume reveals:
- Whether a move is real or fake
- Where smart money is entering or exiting
- When a trend is gaining or losing strength
- The exact moment before a reversal or breakout
Without volume, you’re guessing.
With volume, you’re seeing behind the curtain.
What to Look For in Volume
Not all volume is equal.
Here’s what matters — and what doesn’t.
🔸 1. Volume Spikes at Key Levels
When price approaches support or resistance and volume surges, something’s happening.
- A breakout is about to launch
- Or a trap is being set
Watch the reaction. Watch the wick. Watch the spike.
🔸 2. Low Volume in Consolidation
Smart money doesn’t buy in one candle.
They accumulate or distribute over time — during quiet, low-volume sideways moves.
Silence before the storm.
🔸 3. Volume Climax Events
Biggest volume candle + long wick = exhaustion.
These often mark the end of a move — and the start of the reversal.
🔸 4. Volume Divergence
Price makes new highs, but volume drops?
The move is weak.
Momentum is dying.
Smart money is already out.
How to Use Volume as a Weapon
Step 1: Structure First
Mark your zones. Let price come to you.
Step 2: Watch Volume Behaviour
How does it react at those zones?
- Spike + wick = trap
- Spike + break = confirmation
- No spike = ignore the move
Step 3: Combine Volume with Candles
Volume alone isn’t enough. Pair it with:
- Wick size
- Body strength
- Candle close
Step 4: Manage the Move
- Strong volume = hold
Volume fades = tighten stops or exit
Introducing: Volumetrix
Volumetrix is our custom-built smart money volume indicator — designed to show what other indicators miss.
It’s not a repackaged histogram.
It’s not a paint-by-numbers tool.
Volumetrix was built on battlefield-tested logic — by traders, for traders.
What Volumetrix Shows You
✅ Real-Time Buy/Sell Volume
See the buy-side vs. sell-side activity within each candle.
No more guessing who’s in control.
✅ Volume Delta
Track the imbalance between buying and selling — the same logic used by institutional order flow traders.
Volume Delta shows where the tide is turning before the candle closes.
✅ Cumulative Delta
Zoom out and see the real bias.
Volumetrix tracks whether smart money is accumulating (net buy) or distributing (net sell) over time.
Perfect for spotting hidden reversals or confirming ongoing trends.
Why Volumetrix is Different
Most volume indicators only show this:
“How tall is the volume bar?”
That’s not enough.
Volumetrix breaks it down into four powerful layers:
Feature
Purpose
🔵 Buy Volume
Incoming demand pressure
🔴 Sell Volume
Active supply pressure
🟢 Volume Delta
Early reversal signals
🟠 Cumulative Delta
Hidden smart money bias over time
This gives you a 4D view of market activity.
Volumetrix Gives You the Edge
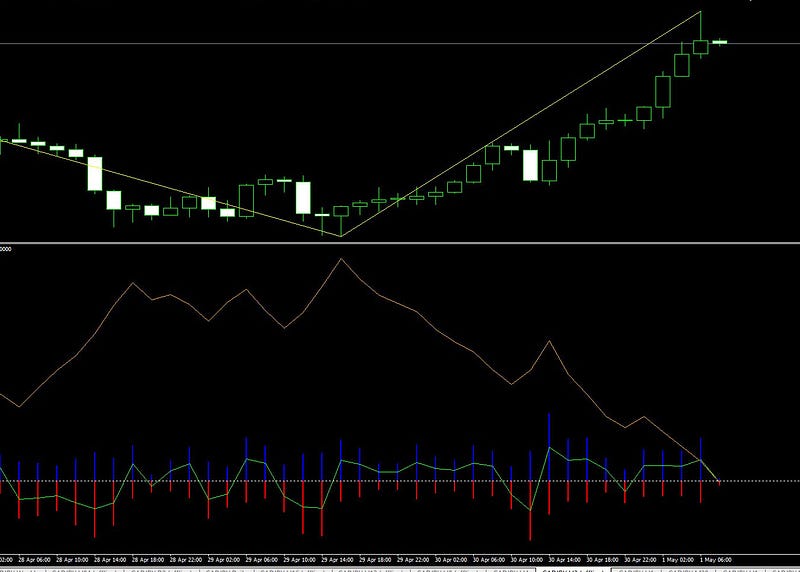
- Early Signal Detection
Delta spikes appear before indicators flip - Volumetrix acts as an early warning system by detecting smart money shifts before price confirms. The delta line — which measures the real-time imbalance between buying and selling — often crosses the zero line just before or immediately after a new candle forms, signalling a change in control. This subtle but powerful move usually happens before oscillators like Stochastics or RSI react, giving you a crucial head start in spotting emerging pivots, trend shifts, or exhaustion points. When used correctly, Volumetrix doesn’t lag — it leads.
- Traps & Fake outs
Price breaks out but Delta drops? It’s a trap. - Continuation Clarity
Cumulative Delta rising = ride it. Smart money is still in. - Reversal Warnings
Delta divergence = take profits or hedge.
Conclusion: Volume is the Truth — Volumetrix Decodes It
Most traders don’t understand volume.
Worse — they ignore it entirely.
That’s like flying through a storm with no radar.
Volumetrix removes the blindfold.
It shows you what smart money is doing in real time.
It gives you context, confirmation, and timing.
Learn to read volume — and you’ll never look at price the same again.
🧠 Smart traders read price.
💼 Smarter traders read structure.
🕵️♂️ The smartest traders read volume.
🧭 What’s Next?
If you’ve made it this far, you’re ready for something deeper.
The next post in this series is: Part 4
👉Smart Money Secrets:
“Volumetrix: See the Shift Before It Hits the Chart.”
🧠 Or head back to the Smart Money Secrets Homepage
Where everything we teach begins with one truth:
You are the edge.
🛒 Ready to Trade Smarter?
👉 Get VoluMetrix – Order Flow Indicator for MT4
See the shift before it hits the chart.
